

Analytics
Overview
Section titled “Overview”Analytics provides comprehensive monitoring capabilities for your phone system, allowing you to gain valuable insights into various key metrics including Call Quality, Answer Times, Call Queue, Hold Times, Leaderboards, and much more.
Analytics can be found by going to Apps → Call History
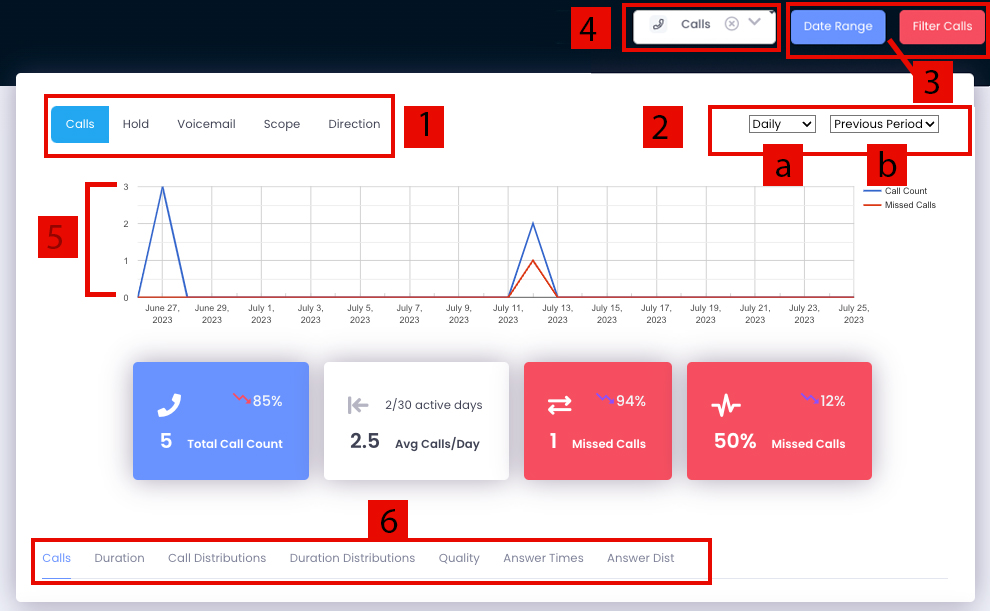
The analytics dashboard includes six main configurable elements:
-
Phone Data Type: Select from Calls, Hold, Voicemail, Scope, or Direction to specify which data displays on graphs.
-
Graph Breakdown Options: Drop-down menus allow changing how graphs are organized on the x-axis, typically including Hourly and Monthly views.
-
Time Frame Selection: Choose the analytics period and apply filters to narrow results. “Applied filters will appear in a new box above the analytics.”
-
Category Expansion: Drop-down menu to access additional categories like Geographical or LeaderBoards.
-
Graphical Representation: Visual display of selected data.
-
Subcategory Selection: Choose specific analytics to update the graphical representation.
Duration
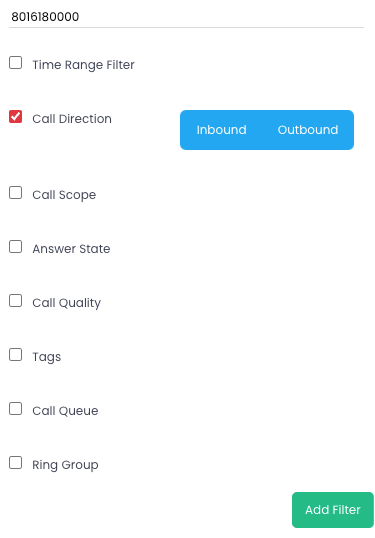
Section titled “Duration”Provides call duration details in minutes with additional graphs available through top menu selection.
Call Distributions
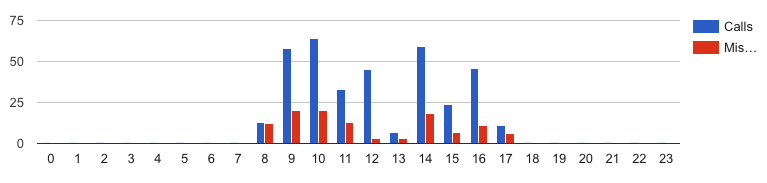
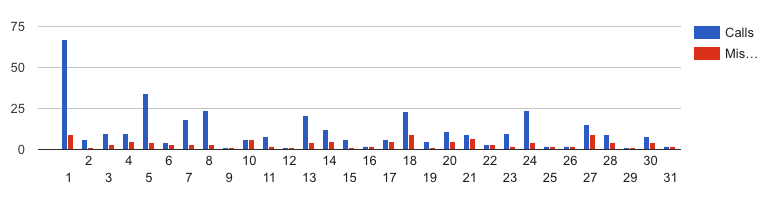
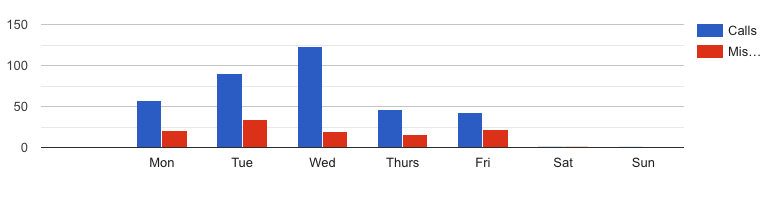
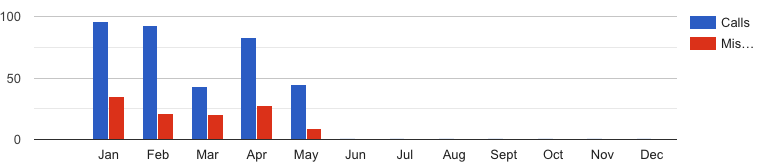
Section titled “Call Distributions”One of the best ways to compare calls versus missed calls over different time periods. Options include:
- Hourly: Based on 24-hour schedule (0 = 12 a.m., 23 = 11 p.m.)
- Daily: Monthly breakdown by individual days
- Weekly: Monday-Sunday view grouped by date range
- Monthly: Organized by months
Duration Distributions
Section titled “Duration Distributions”A graphical representation of the amount of time spent on particular calls.
Geographical
Section titled “Geographical”Provides a geographical map of the U.S. with color coding for viewing phone call distributions across regions.
Quality
Section titled “Quality”Offers a quick overview of overall call quality, showing average call quality and identifying where quality dips occurred during the selected date range.
Answer Times
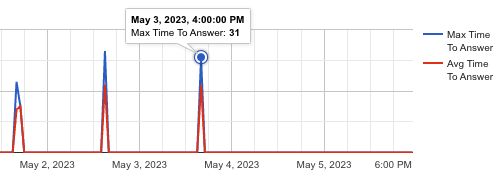
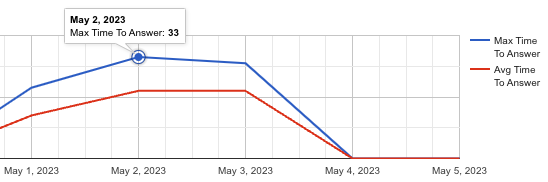
Section titled “Answer Times”Breaks down both maximum and average answer times for calls. Multiple graph versions are available through dropdown selection, with hover details providing additional information. Hourly and Daily graphs prove especially useful.
Answer Distributions
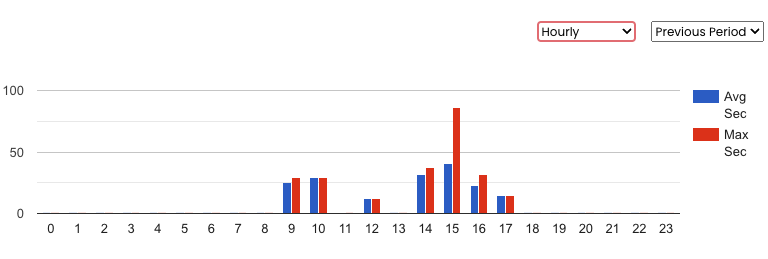
Section titled “Answer Distributions”Provides graphical representation of answer time using bar graphs, breakable into Hourly, Daily, Weekly, and Monthly views. These offer key insights into busy times.
LeaderBoards
Section titled “LeaderBoards”Leaderboards provide an overall snapshot of user performance including number of group calls answered and time spent on calls.
To access LeaderBoards, select the ‘Calls’ drop-down menu next to the Date Range and select LeaderBoards.

Location
Section titled “Location”Uses the same metrics as LeaderBoards but shows overall location performance rather than individual user metrics.
Numbers
Section titled “Numbers”Shows similar analytics to LeaderBoards, broken down by which number was called, including direct dial numbers.
